Tutorial for Mechanical Cell-Cell Communication#
import mechanochat as mc
import scanpy as sc
from matplotlib import pyplot as plt
import numpy as np
/home/kxy/miniforge3/envs/mc_test/lib/python3.9/site-packages/tqdm/auto.py:21: TqdmWarning: IProgress not found. Please update jupyter and ipywidgets. See https://ipywidgets.readthedocs.io/en/stable/user_install.html
  from .autonotebook import tqdm as notebook_tqdm
Load Data#
imputed seqFISH data from mouse embryo
Steps for preparing the dataset: https://github.com/XiangyuKuang/mechanochat-tutorials/blob/main/seqfish/prepare_dataset.md
adata = sc.read_h5ad('../Mouse_Embryo_seqFISH_imputed.h5ad')
adata = adata[adata.obs['z']=='2'].copy()
cluster_key = 'celltype_mapped_refined'
# remove low quality cells
I = adata.obs[cluster_key] == 'Low quality'
adata = adata[~I].copy()
sc.pp.filter_cells(adata,min_genes=100)
sc.pp.filter_genes(adata,min_cells=3)
sc.pp.pca(adata)
crop data
x = adata.obsm['spatial']
cid = (x[:,0]>=1540) & (x[:,0]<(1540+57)) & (x[:,1]>=1418) & (x[:,1]<(1418+57))
adata_crop = adata[cid].copy()

# remove cell types that only have one cells
group_counts = adata_crop.obs[cluster_key].value_counts()
small_groups = group_counts[group_counts == 1].index.tolist()# 2. 找出只含 1 个细胞的分组
I = ~adata_crop.obs[cluster_key].isin(small_groups)# 3. 过滤掉这些分组对应的细胞
adata_crop = adata_crop[I].copy()
del adata
MechanoChat Analysis#
load mechanochat db
df_stiffness, df_adh, df_IonTF, df_lr = mc.pp.load_mechanochat_db('mouse')
df_stiffness = mc.pp.filter_db(df_stiffness,adata_crop,filter_criteria='min_cell',min_cell=1)
df_IonTF = mc.pp.filter_db(df_IonTF,adata_crop,filter_criteria='min_cell',min_cell=1, alias_col='Alias')
df_adh = mc.pp.filter_lr_database(df_adh, adata_crop,filter_criteria='min_cell',min_cell=1)
df_lr = mc.pp.filter_lr_database(df_lr, adata_crop,filter_criteria='min_cell',min_cell=1)
print('stiffness gene db',df_stiffness.shape[0],)
print('adhesion gene db',df_adh.shape[0])
print('IonTF db',df_IonTF.shape[0])
filter_db: symbol not in adata.var_names, using alias instead: Mrtfa->Mkl1, Mrtfb->Mkl2
stiffness gene db 45
adhesion gene db 55
IonTF db 13
SEM simulation#
sem = mc.SEM2(
    adata=adata_crop,
    cluster_key = cluster_key,
    sim_name='seqfish',
)
sem.get_param(
    df_adh=df_adh,
    df_stiffness=df_stiffness
)
sem.sim_gpu()
# sem.save_sim()
add .beta .alpha_csr .param_info
Simulation:   0%|          | 0/1000 [00:00<?, ?it/s]/home/kxy/miniforge3/envs/mc_test/lib/python3.9/site-packages/numba/cuda/dispatcher.py:536: NumbaPerformanceWarning: Grid size 56 will likely result in GPU under-utilization due to low occupancy.
  warn(NumbaPerformanceWarning(msg))
Simulation: 100%|██████████| 1000/1000 [00:02<00:00, 354.17it/s]
cell-cell contact and force
sem.compute_contact()
sem.compute_force()
add .obsp['contacts'], .uns['contacts'] to adata
add .pairs
add .f_pairs
add .f_cc
add .obsp['f_cc'] to adata
Computing force by chunk: 100%|██████████| 1/1 [00:00<00:00, 6.11it/s]
cell shape and mechanical interaction (fig 3b, c)#
fig, ax = plt.subplots(figsize=(12,12))
mc.pl.alphashape_plot(sem,ax=ax,show_axis=False,)
Computing alpha-shape with parameters: alpha=None, ns=10, r=1.5
Processing Cell Shapes:   0%|          | 0/1030 [00:00<?, ?it/s]
Processing Cell Shapes: 100%|██████████| 1030/1030 [00:04<00:00, 244.79it/s]
<Axes: >
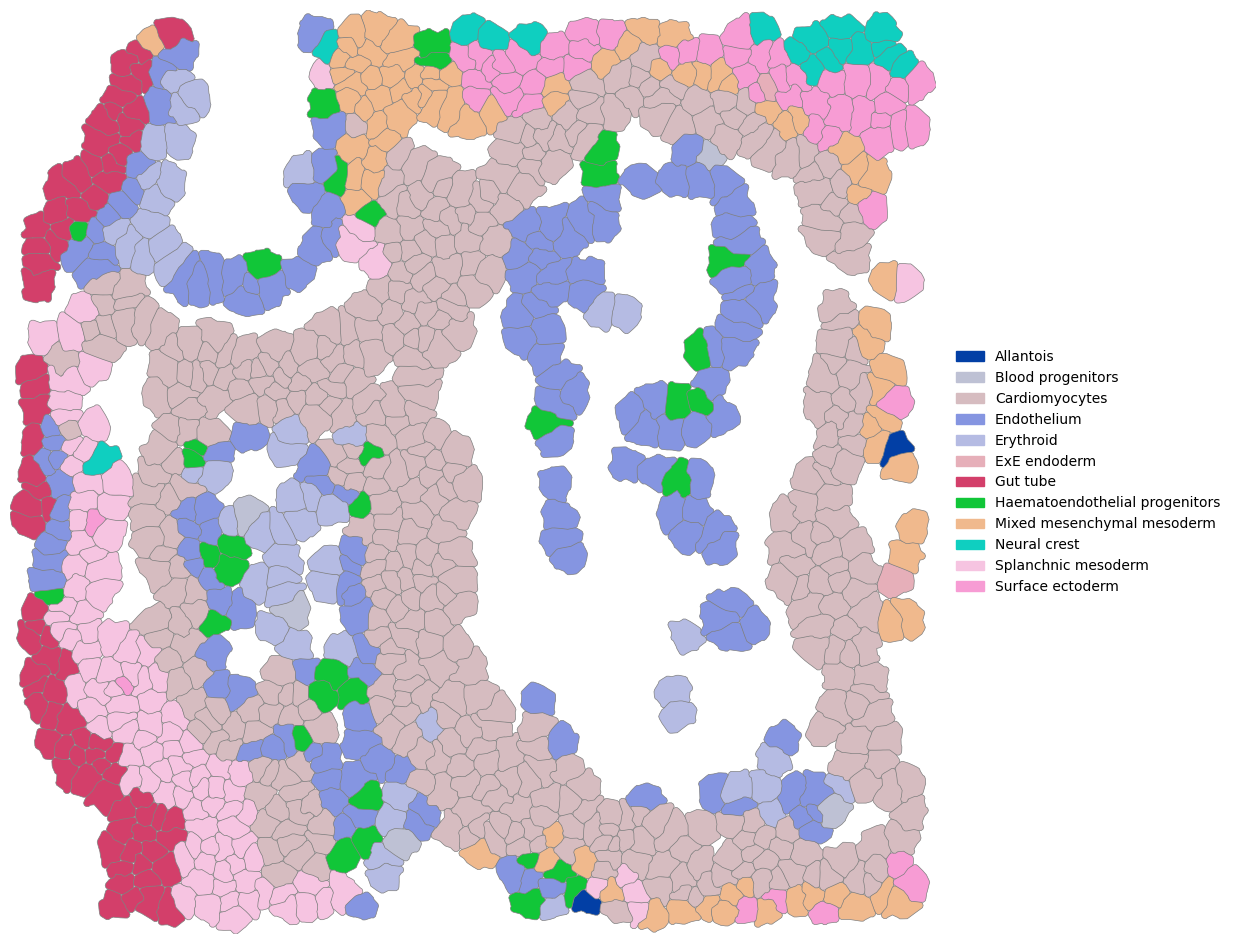
fig3b
fx_csr, fy_csr = sem.f_pairs_tocsr()
ctri = mc.tl.contact_analysis(sem)
ctri.compute_contact_force()
create ctri for sem seqfish
add ctri.cell_boundary
add .contact_midedge_dict
add .contact_f_dict
add .junction_midedge_dict
add .junction_f_dict
fig,ax = plt.subplots(figsize=(12,12))
mc.pl.alphashape_plot(sem,ax=ax,boundary_width=0.5,boundary_color='gray',)

norm = plt.Normalize(vmin=0.05 ,vmax = 0.8)
mc.pl.contact_plot(
    ctri,
    vis_key = 'mechanical interaction',
    line_width = 2.5,
    norm = norm,
    mean_edge_value = False,
    ax=ax
)

mc.pl.draw_colorbar(norm=norm,cmap_name = 'inferno',orientation='vertical',label = 'Mechanical Interaction')
<Axes: ylabel='Mechanical Interaction'>
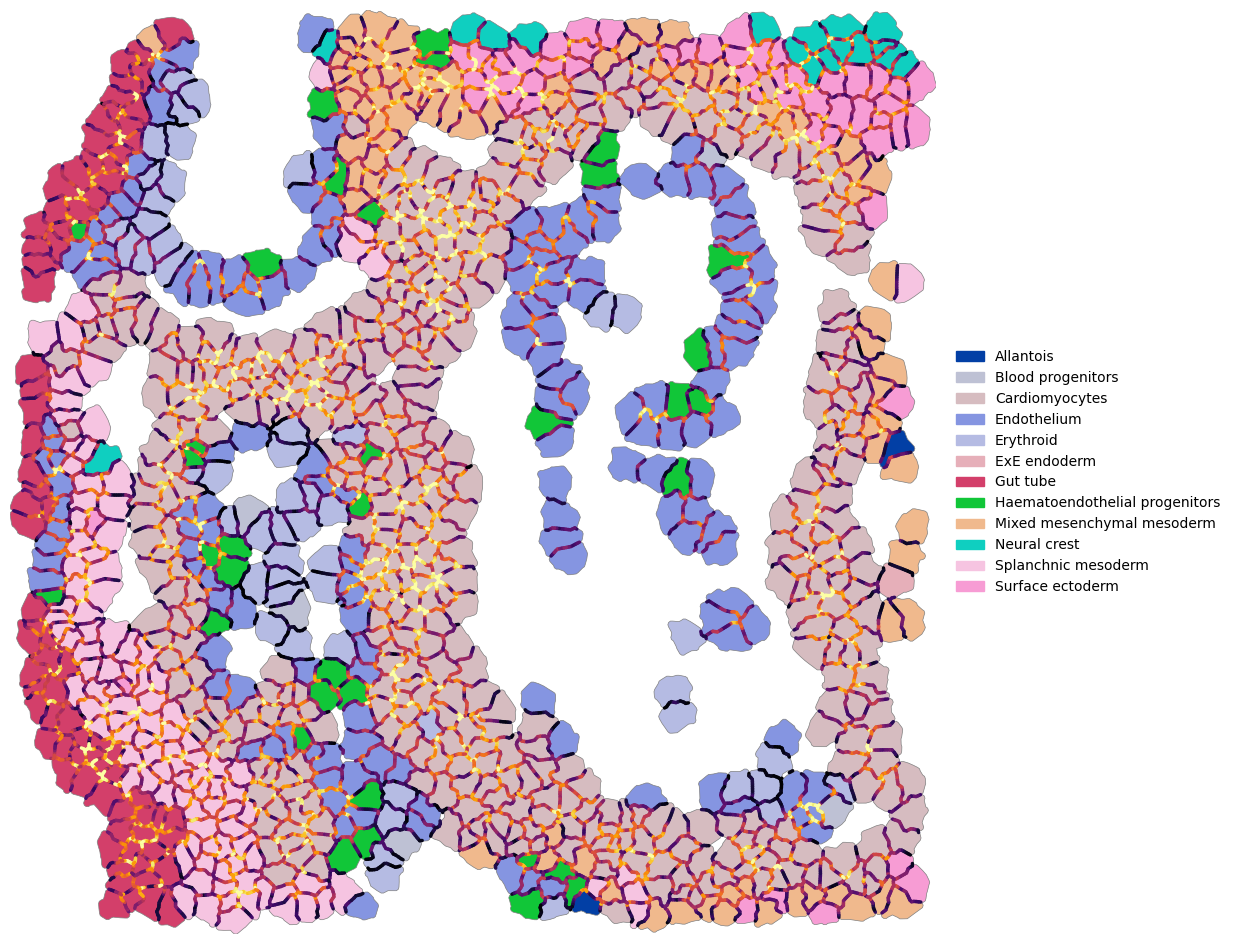
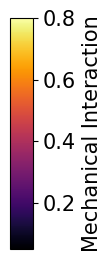
fig3c
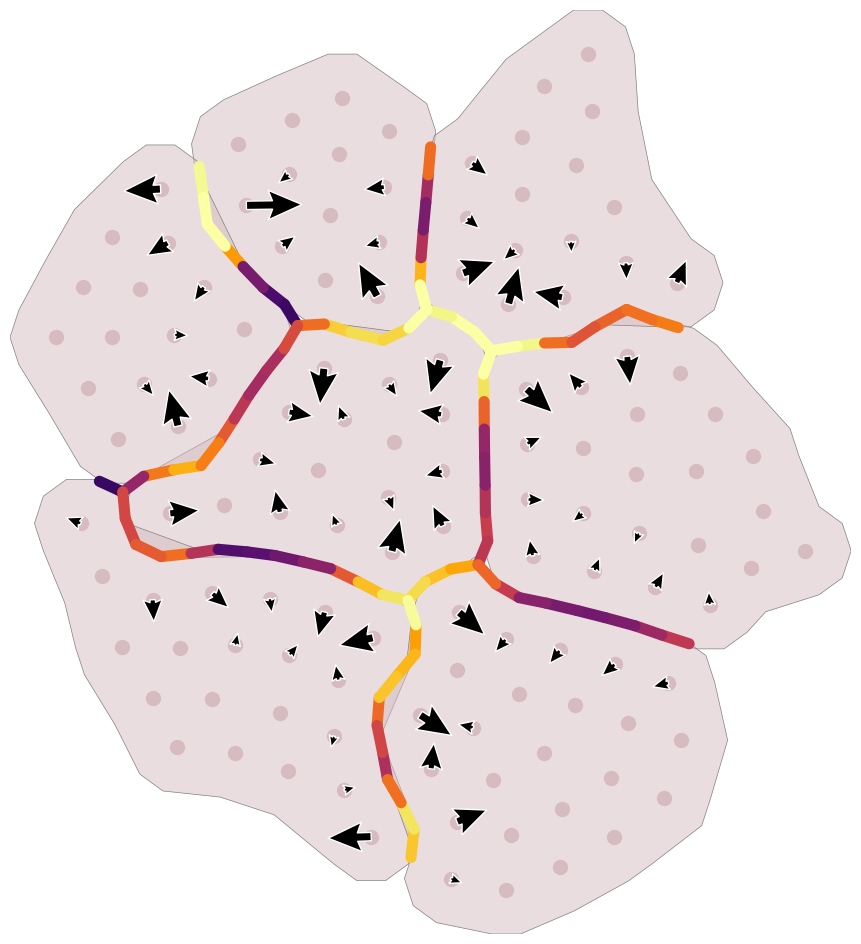
# cid_list = [733,746,747,457]
cid_list  = [ 830, 829, 841, 821, 817, 839, 840]

fig,ax = plt.subplots(figsize=(12,12))
mc.pl.alphashape_plot(
    sem,ax=ax,boundary_width=0.5,
    face_alpha=0.5,
    enable_legend=False,
    cid_list = cid_list,
)
mc.pl.element_plot(sem,ax=ax,cid_list=cid_list,enable_legend=False,spot_size=100)
mc.pl.contact_plot(
    ctri,
    vis_key = 'mechanical interaction',
    mean_edge_value=False,
    line_width=8,
    cid_list=cid_list,
    norm = norm,
    ax=ax
)
mc.pl.forceij_plot(sem,cid_i=cid_list,fx_csr=fx_csr,fy_csr=fy_csr,ax=ax,
    fmin = 0.2,
    scale=14,
    linewidths=1,
    edgecolor = 'w'
)
<Axes: >
Mechanical cell-cell communication analysis (fig 3d, e)#
mc.tl.mechanical_communication(sem, df_IonTF, df_lr)
print(adata_crop)
apply log1p to cell-cell mechanical interaction
add .obsm['sender_mechano_signal'], .obsm['receiver_mechano_signal'], .uns['mechano_signal_info']
AnnData object with n_obs × n_vars = 1030 × 20914
    obs: 'celltype_mapped_refined', 'z', 'n_genes'
    var: 'n_cells'
    uns: 'celltype_mapped_refined_colors', 'pca', 'contacts', 'mechano_signal_info'
    obsm: 'spatial', 'X_pca', 'sender_mechano_signal', 'receiver_mechano_signal'
    varm: 'PCs'
    obsp: 'contacts', 'f_cc', 'mechano_Piezo1', 'mechano_Piezo2', 'mechano_Kcnk2', 'mechano_Kcnk10', 'mechano_Tmem63a', 'mechano_Tmem63b', 'mechano_Tmem87a', 'mechano_Trpv4', 'mechano_Yap1', 'mechano_Mkl1', 'mechano_Mkl2', 'mechano_Ctnnb1', 'mechano_Srf', 'mechano_Cdh1-Itga2_Itgb1', 'mechano_Cdh1-Itgae_Itgb7', 'mechano_Cspg4-Itga3_Itgb1', 'mechano_Gp1ba-Itgam_Itgb2', 'mechano_Icam1-Itgax_Itgb2', 'mechano_Icam1-Itgal_Itgb2', 'mechano_Icam2-Itgal_Itgb2', 'mechano_Icam1-Itgam_Itgb2', 'mechano_Icam2-Itgam_Itgb2', 'mechano_Icam1-Itgam_Itgb2l', 'mechano_Icam2-Itgam_Itgb2l', 'mechano_Icam1-Itgal', 'mechano_Jam2-Itga3_Itgb1', 'mechano_Jam2-Itgav_Itgb1', 'mechano_Jam3-Itgam_Itgb2', 'mechano_F11r-Itgal_Itgb2', 'mechano_Jam3-Itgam_Itgb2l', 'mechano_L1cam-Itgav_Itgb3', 'mechano_L1cam-Itga4_Itgb7', 'mechano_Madcam1-Itga4_Itgb7', 'mechano_Dll1-Notch1', 'mechano_Dll1-Notch3', 'mechano_Dll1-Notch4', 'mechano_Dll3-Notch1', 'mechano_Dll3-Notch2', 'mechano_Dll3-Notch3', 'mechano_Dll3-Notch4', 'mechano_Dll4-Notch1', 'mechano_Dll4-Notch2', 'mechano_Dll4-Notch3', 'mechano_Dll4-Notch4', 'mechano_Jag1-Notch1', 'mechano_Jag1-Notch2', 'mechano_Jag1-Notch3', 'mechano_Jag1-Notch4', 'mechano_Jag2-Notch1', 'mechano_Jag2-Notch2', 'mechano_Jag2-Notch3', 'mechano_Jag2-Notch4', 'mechano_Dll1-Notch2', 'mechano_Sema7a-Itgb1_Itga1', 'mechano_Thy1-Itgam_Itgb2', 'mechano_Thy1-Itgax_Itgb2', 'mechano_Thy1-Itgav_Itgb3'
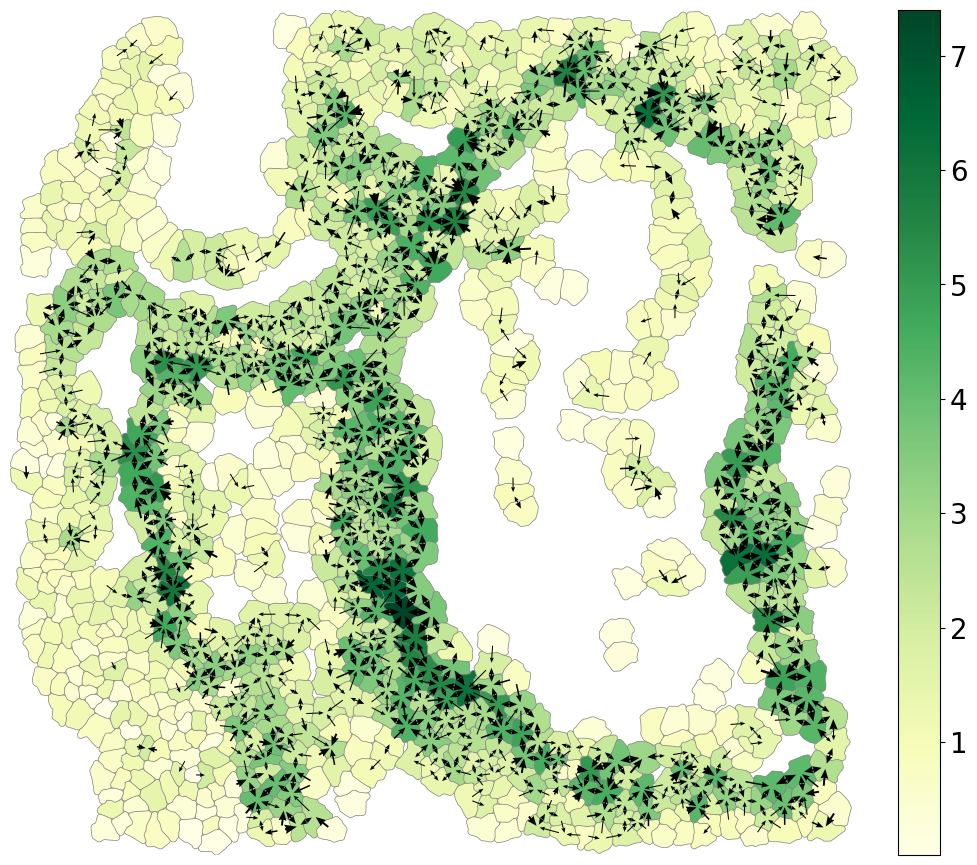
fig 3d receiver signal and signal tensor#
fig, ax = plt.subplots(figsize=(12,12))
sig_key = 'Srf'
ax = mc.pl.alphashape_plot(
    sem,
    ax=ax,
    vis_key = f'r-{sig_key}',
    summary = 'receiver_mechano_signal',
    boundary_color='gray',
    boundary_width=0.5,
    cmap_name= 'YlGn',
    show_axis=False,
)

ax=mc.pl.signal_direction_plot(
    sem,signal=f'mechano_{sig_key}',
    ax=ax,
    quiver_length=0.7,
    width_bin_n = 6,
    width_scale = [0.6,2],
    th = lambda x: np.percentile(x,60),
)
sig_mat data th 0.39048896431922914
sig_key = 'Srf'
Nx = 12
a = 4.5
xc = sem.xc*sem.scale+sem.deltax
xc2grid_map, grid_center, x_grid, y_grid = mc.tl.cell2grid(xc,Nx)
sig_mat = adata_crop.obsp[f'mechano_{sig_key}']
Xgrid, Vegrid, Sgrid = mc.tl.signal_tensor(xc, xc2grid_map, grid_center, sig_mat)
Vegrid = Vegrid/Vegrid.max()*a
arr = adata_crop.obsm['receiver_mechano_signal'][f'r-{sig_key}']
vmax = np.percentile(arr,99)
vmin = np.percentile(arr,1)

fig, ax = plt.subplots(figsize=(12,12))
ax = mc.pl.alphashape_plot(
    sem,
    ax=ax,
    vis_key = f'r-{sig_key}',
    summary = 'receiver_mechano_signal',
    boundary_color='gray',
    boundary_width=0.5,
    cmap_name= 'YlGn',
    vmax = vmax,
    vmin = vmin,
)
mc.pl.plot_grid_signal_tensor(Xgrid, Vegrid,
    scale = 150,
    pivot = 'tail',
    headwidth = 2.5,
    headlength = 3.2,
    headaxislength = 3,
    width = 0.004,
    color = 'k',
    scale_units = 'width',
    ax=ax
)
<Axes: >
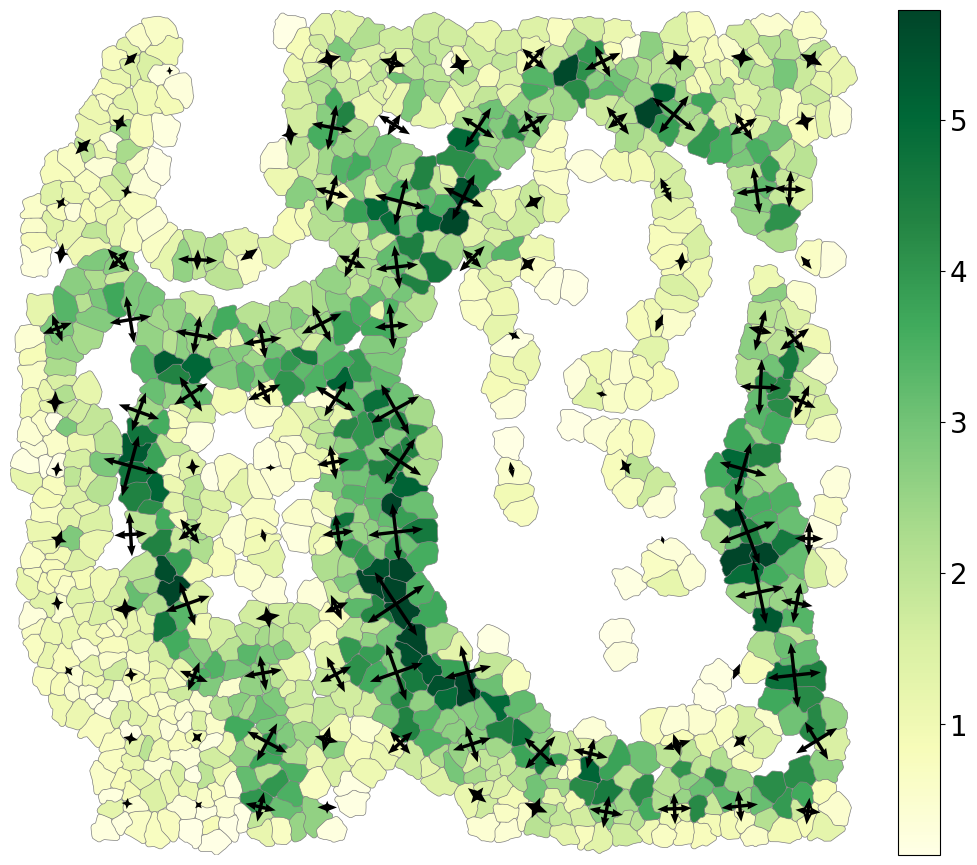
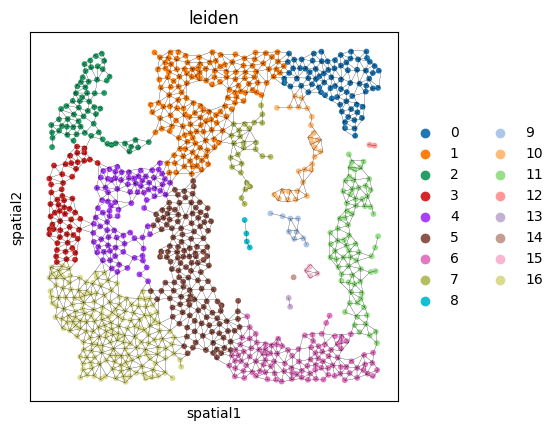
fig 3e spatial-domain-level communicaion#
spatial domain
import random
random.seed(0)
np.random.seed(0)

f_cc_th = sem.adata.obsp['f_cc'].copy()
th = np.percentile(f_cc_th.data,10)
I = f_cc_th.data < th
f_cc_th.data[I] = 0
f_cc_th.eliminate_zeros()
sem.adata.obsp['f_cc_th'] = f_cc_th
sc.tl.leiden(sem.adata,resolution=0.3,obsp = 'f_cc_th',flavor='igraph',n_iterations=2)#
if 'leiden_colors' in sem.adata.uns_keys():
    del sem.adata.uns['leiden_colors']
fig,ax = plt.subplots()
sc.pl.spatial(sem.adata,color = 'leiden',spot_size=1,ax=ax,show=False)
mc.pl.vis_contact_signal(sem,sig_mat=f_cc_th,ax=ax,line_width=0.1)
<Axes: title={'center': 'leiden'}, xlabel='spatial1', ylabel='spatial2'>
sem.adata.obs[f'{cluster_key}_mc'] = (sem.adata.obs[cluster_key].astype(str) + '_' + sem.adata.obs['leiden'].astype(str)).astype('category')
subgroup_counts = sem.adata.obs[f'{cluster_key}_mc'].value_counts()
small_groups = subgroup_counts[subgroup_counts < 10].index
sem.adata.obs.loc[sem.adata.obs[f'{cluster_key}_mc'].isin(small_groups), f'{cluster_key}_mc'] = np.nan
sem.adata.obs[f'{cluster_key}_mc'] = sem.adata.obs[f'{cluster_key}_mc'].cat.remove_unused_categories()
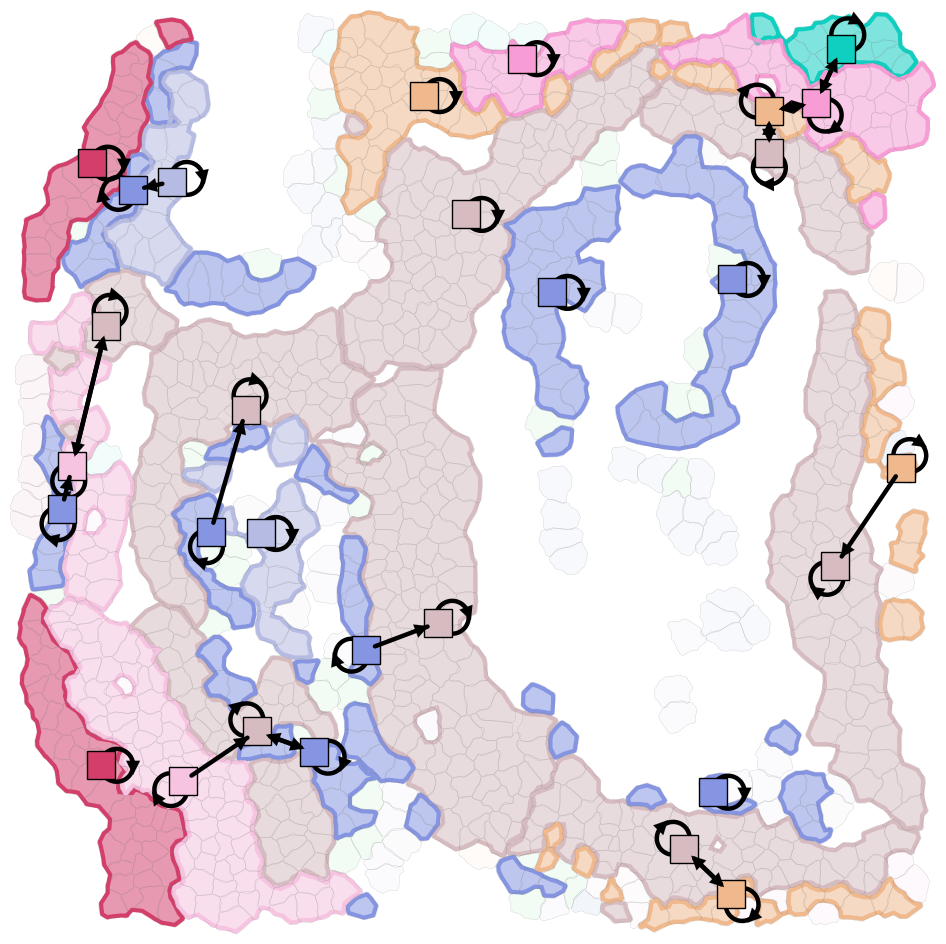
spatial-domain-level communicaion
mc.tl.cluster_communication(
    adata = sem.adata,
    cluster_key = f'{cluster_key}_mc',
    signal = 'Srf',
    n_permutations=1000,
)
df_qvalue = sem.adata.uns[f'{cluster_key}_mc_mechano_Srf']['adjusted_communication_pvalue']
visualization
# outline clusters
cmap = dict(zip(sem.adata.obs[cluster_key].cat.categories,sem.adata.uns[f'{cluster_key}_colors']))
fig, ax = plt.subplots(figsize=(12,12))
for ct1 in list(sem.adata.obs[f'{cluster_key}_mc'].cat.categories):
    I = sem.adata.obs[f'{cluster_key}_mc']  == ct1
    ct = sem.adata.obs[cluster_key][I].unique()[0]
    cid_list = np.where(I)[0]
    ar = np.zeros_like(cid_list,dtype=float)
    for n,i in enumerate(cid_list):
        ar[n] = sem.alphashape[i].alpha

    mc.pl.highlight_cell(sem,
        cid_list,
        cmap[ct],
        ar = ar.max()*1.5,
        r = 0.5*sem.scale,
        lw=3,
        ax=ax,
        face_alpha=0.5,
        edge_alpha=1,
        zorder = 1,
    )

mc.pl.alphashape_plot(sem,ax=ax,face_alpha=0.05,boundary_width=0.1,enable_legend=False)
mc.pl.spatial_domain_comm_plot(sem,df_qvalue,cluster_key,ax=ax)
<Axes: >
save adata
adata_crop.write_h5ad(f'{sem.sim_name}.h5ad')